
A client sent us a screenshot last spring with the subject line “so why is the phone not ringing”. It was the Search Console performance chart for their main service page: average position 3.5, with the line drifting gently downward, which on that chart is the good direction. They had been forwarding it to their board for two quarters. The page had produced eleven clicks that month, and searching the term they actually cared about did not surface them anywhere in the first four pages of results.
Nothing in the report was wrong. Search Console was reporting precisely what it documents itself as reporting. The trouble is that almost nobody reads “average position” as the sentence Google actually wrote, and that misreading has become the most dependable way for a business to feel good about a page that is doing nothing at all.
What average position actually measures
Three separate claims are folded into that one number, and all three are stated plainly in Google’s documentation on impressions, position and clicks. They are worth pulling apart.
It is an average, weighted by impressions. Every time your page is shown for a query, its position that time enters the pool. A query that shows you ninety times contributes ninety values; a query that shows you twice contributes two. The reported figure is the mean of the pool, so it describes the pool, not the page.
It is the topmost position your result held. If a page appears twice on the same results page, the higher appearance is the one recorded. And position is counted among organic results, which is a much narrower thing than a place on the screen.
It is scoped to whatever filter is applied, and the default filter in the performance report is the entire property over the last three months, across every query, country, device and search type at once. An unfiltered average position is close to meaningless, in the same way that the average temperature of a house tells you nothing useful if the oven is on and a window is open.
None of this is buried. It simply reads like a rank, and a number that reads like a rank will be treated as one by everybody who is not looking closely.
Why the average flatters a page that is failing
The mechanism that produces the 3.5 in that screenshot is not subtle once you see it, and it is nearly universal on informational and service pages alike.
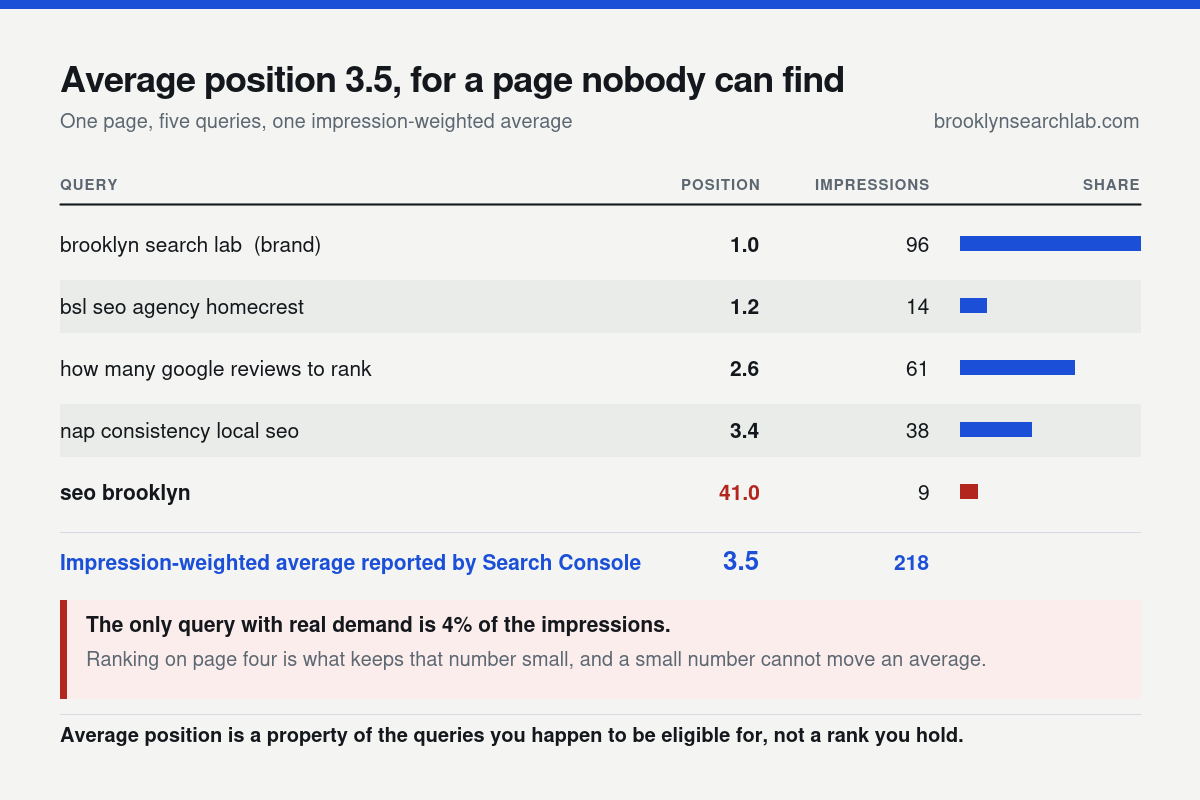
Most of the impressions a page collects come from queries nobody at the company has ever typed. Long, specific, low-volume phrasings, often with a place name or a year in them, where three or four pages in the world are genuinely relevant and yours is one of them. You rank first or second on those because almost nothing is competing. They are real impressions and they enter the average at position 1.4.
Then there are your brand searches. People who already know you, looking for you by name, on which you are position 1.0 forever. On a young site those can be a third of all impressions.
And then there is the query the business actually cares about, where you sit on page four. Here is the part that makes the whole thing self-concealing: ranking badly suppresses your impression count for that query. An impression is recorded when your result is in the set of results the user could see, so a page-four listing is shown to a small fraction of the people who search the term. The query you care most about therefore contributes the fewest values to the average, precisely because it is doing worst. Failure hides itself by being small.
A rising average position is not automatically good news, and a falling one is not automatically bad. A page that starts becoming eligible for harder, higher-volume queries will see its average position get worse while the business gets better. That is the single most misread signal in the report.
Position one is not the top of the page
The second half of the gap has nothing to do with averages. Position counts your rank among organic results. It does not describe where on the screen those organic results begin.
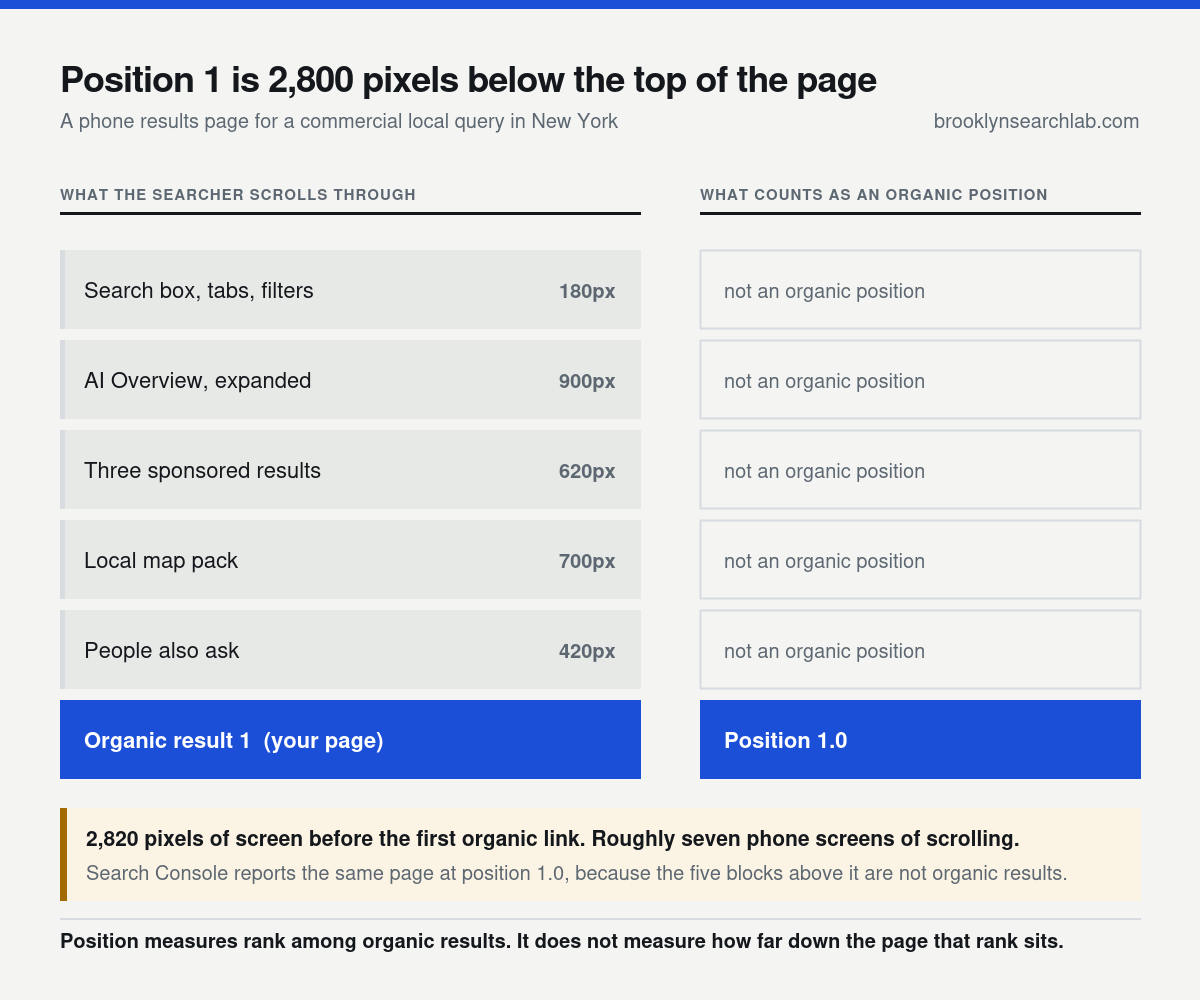
On a commercial query in a dense market, the first organic result can sit several thousand pixels down. An AI Overview, three sponsored listings, a map pack and a People also ask block are each large, each answer the question in place, and none of them is an organic position. Google’s guidance on AI features and your website is explicit that these surfaces sit alongside the results rather than replacing the ranking, which is exactly why the report can say position 1.0 while a person holding a phone never reaches you.
This is also why click-through rate is the more honest companion metric. Position tells you where you finished. CTR tells you whether finishing there was worth anything on that particular results page. A page holding position 2 with a 0.4% CTR is not being beaten on ranking. It is being beaten by the page itself, and if the answer is fully rendered above you, the winning move is usually to be a destination worth a click rather than an answer worth a snippet.
Your position is an average over the whole map
Search results are assembled per person, per place. Google’s own explanation of why your Search results differ from others lists location, language, device and search history among the inputs, which means “your position” was never a single fact to begin with. It is a distribution, and Search Console hands you its mean.
New York exaggerates this more than almost any market in the country. A Brooklyn firm can be position 2 for a service term in Homecrest, position 6 in Park Slope and position 25 in Midtown, and the report will show one figure somewhere in the low teens that describes none of those places. Because local ranking weighs relevance, distance and prominence together, physical proximity keeps re-sorting the same page as the searcher moves, and eight miles of subway is enough to change the answer completely. It is the reason SEO in Brooklyn and SEO in Manhattan are genuinely different problems for the same business, and why a profile can rank first in Brooklyn and vanish in Manhattan without anything changing on the site.
Checking your own rank from the office does not fix this. It replaces an average you do not understand with a single sample taken from the one location where you are most likely to look good, on a machine that has visited your site a thousand times.
The page you are looking at may not be the page being measured
One more mundane possibility accounts for a surprising share of these conversations. Search Console reports on the canonical URL Google selected, not necessarily the URL you typed into the filter. Which URL it selects is not entirely your decision either: when your internal links and sitemap disagree with your canonical tag, Google resolves the conflict without asking you. If Google has consolidated a trailing-slash variant, a parameterised version or a near-duplicate location page onto a different canonical, the impressions and positions live on that other row, and the page you are inspecting looks quiet for reasons that have nothing to do with ranking.
The property boundary catches people the same way. A URL-prefix property for the www hostname does not report on the same site without the www, and a business that migrated without consolidating properties can have two years of history split across four of them. Before diagnosing anything, confirm you are looking at a domain property, and check the page’s chosen canonical in the URL Inspection tool.
What you can actually control
1. Filter to one query before you read a position
A position is only meaningful for a single query, in a single country, on a single device. Open the Queries tab, click the one term you care about, then read the position on that filtered view. Almost every panicked or triumphant reading of this report dissolves at this step.
2. Never read position without impressions and clicks beside it
Position 3 on nine impressions is not a ranking, it is an anecdote. Sort by impressions and ignore any row below a threshold you set in advance, so the long tail stops setting your mood.
3. Split branded from unbranded
Add a regex filter excluding your company name and every misspelling of it. What remains is the only part of the report that reflects work you did rather than demand you already had. On most young sites this halves the impression count and doubles the average position, and that worse-looking number is the true one.
4. Compare like windows, not the default
The three-month default smooths away exactly the changes you are trying to detect. Use 28 days against the previous 28, and compare the same days of the week, because search demand for professional services is a weekday phenomenon and a window that includes an extra Monday is not comparable.
5. Look at the actual results page, in the place your customers are
Open the query on a phone, signed out, with the location set to the neighbourhood you serve, and scroll. Count what sits above the first organic result. That single exercise reframes more strategy conversations than any report we produce, and it is where the map pack ranking factors stop being abstract.
6. Confirm the URL being measured
Run the page through URL Inspection and read the Google-selected canonical. If it differs from the URL you submitted, the ranking question was the wrong question and the consolidation is the actual finding.
Position is an eligibility report, not a scoreboard
Here is the reframing that changes how the report gets used. Average position is best understood as a description of the queries you are currently eligible to appear for. It moves when that set of queries changes, and the set changes far more often than your ranking on any given term does.
Which means the useful questions are different ones. How many distinct queries with genuine demand does this page appear for at all? Is that number growing? What is the position on those specific queries, read one at a time? Breadth of impressions on commercially meaningful terms is a leading indicator and it is comparatively hard to fake. Average position is lagging, noisy, and trivially flattered by traffic you were always going to get.
The pattern to want is impressions climbing on unbranded terms while the average position gets modestly worse. That combination means the page has been let into rooms it could not previously enter. The pattern to fear is a beautiful average position that has been stable for six months, because a number that never moves is usually measuring a set of queries that never changes, which is another way of saying the page has stopped growing.
Once the question becomes eligibility rather than rank, the fixes stop being reporting fixes. They are the ordinary, unglamorous work: pages that deserve to be eligible for harder queries, a site fast enough that the experience signals are not working against you, a design that earns the click when the answer is already on the screen above you, and for local businesses a profile and review base strong enough to compete in the block that actually occupies the top of the page. That combination of search work and build work is the entire reason the two sit in the same shop here.
Key takeaways
- Average position is impression-weighted. It describes the queries you were shown for, not your rank on the one that matters.
- Ranking badly suppresses impressions, so your worst query contributes least to the average and hides inside it.
- Position counts organic results only. An AI Overview, ads, the map pack and People also ask can put position 1 thousands of pixels down.
- The number is an average over every location. In New York that spans a page-one result in Homecrest and a page-three result in Midtown.
- Check the canonical before diagnosing a ranking. Search Console reports on the URL Google chose, not the one you typed.
- Read position as eligibility. Impressions widening on unbranded terms beats a pretty average that never moves.
What to do this week
- Open the report, set the range to 28 days, and exclude your brand name with a regex query filter. Write down the new average position. That is your real one.
- Sort unbranded queries by impressions and take the top ten. These are the only rows worth a strategy discussion.
- Read the position for each of those ten individually. The spread between them is the finding, not the mean.
- Search your three most valuable terms on a phone, signed out, with location set to a neighbourhood you serve. Note what occupies the screen before the first organic link.
- Run your money page through URL Inspection and confirm the Google-selected canonical is the URL you think you are ranking.
- Chart unbranded impressions month over month. If that line is flat, the average position was never the problem.
Common questions
My average position improved but clicks fell. What happened?
Usually the query mix changed. You lost impressions on a hard, high-volume term where you were ranking poorly, which removed the values dragging the average down. Fewer clicks and a better average is the classic signature of losing ground, not gaining it.
Is average position ever useful?
Yes, filtered to one query, one country and one device, tracked over time. Read that way it is a decent trend line. Read unfiltered at property level it is a summary statistic of a set you never defined.
Why does a rank tracker disagree with Search Console?
They measure different things. A tracker takes one sample from one specified location, signed out. Search Console averages real impressions across every location, device and personalisation state. Both can be right at once, and if you need a local answer the tracker with a defined location is closer to the question you are asking.
Does checking my own rankings hurt them?
No. It does distort what you see, because your own results are shaped by location and history, and it can add a handful of impressions with no clicks to your own report. Use a signed-out browser and set the location deliberately.
My page ranks first for a query with 40 impressions a month. Is that worth anything?
Sometimes a great deal, if the query has commercial intent and the searcher is qualified. Forty impressions for an emergency service term plus a neighbourhood name is a better asset than four thousand for a term nobody buys from. Judge by intent, not volume.
How long before real changes show in the report?
Technical fixes can move within days of recrawling. Content and authority changes tend to surface over six to twelve weeks, and the first thing that moves is usually impressions on new queries rather than position on existing ones. That is why breadth is the metric to watch first.
Find out what your report is actually telling you
The free audit reads your Search Console data the way it should be read: branded stripped out, positions resolved query by query, and the real results page checked from the neighbourhoods you serve. You get the list of terms you are genuinely eligible for and the ones you only appear to be winning. Five business days, no obligation.
Related: SEO services, areas we serve, who we are.