

Two weeks ago we took a client site from a mobile Lighthouse performance score of 73 to 95. Their rankings did not move. Not that week, not the next one. That is not a failure, and understanding why is the difference between spending money on speed work that pays and spending it on a number that flatters a report.
Core Web Vitals are real. They are also one of the most oversold ideas in SEO, and the gap between what they actually do and what agencies imply they do is wide enough to waste a serious budget in.
Here is what genuinely moves rankings, what is noise, and how to tell which is which.
What Core Web Vitals actually measure
Three metrics, each answering a different question about what it feels like to use your page. Google documents them in full on web.dev.
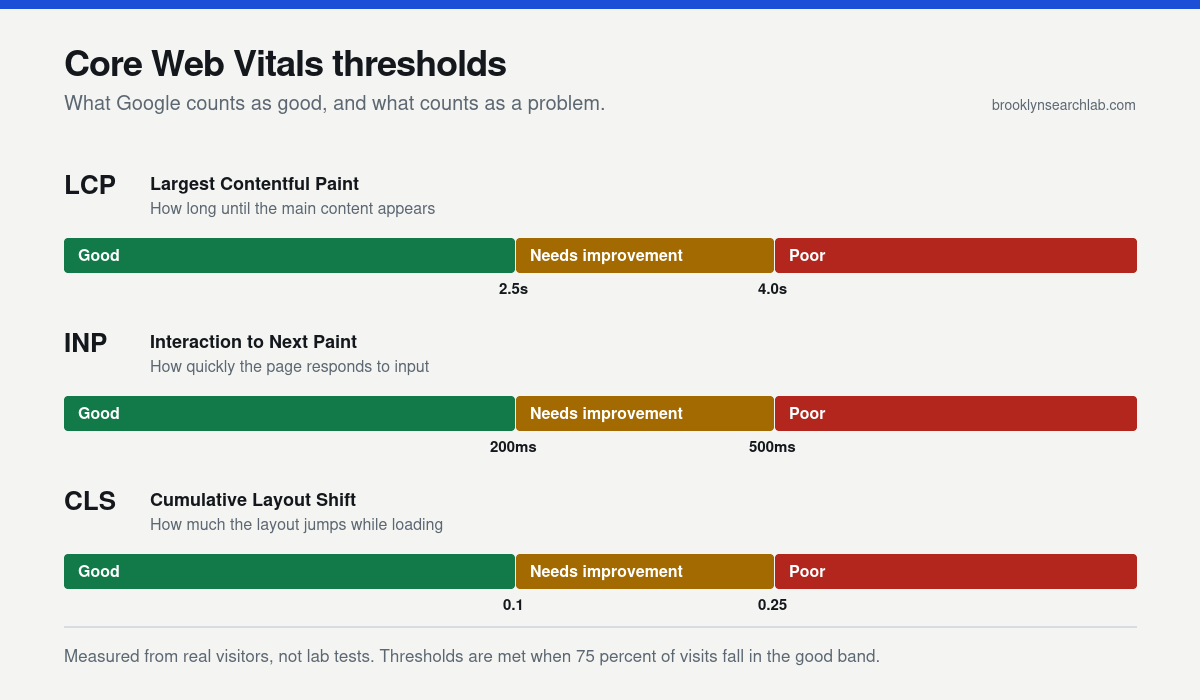
Largest Contentful Paint is how long until the main content appears. Not the first pixel, the thing the visitor came for. Good is under 2.5 seconds.
Interaction to Next Paint is how quickly the page responds when someone taps or clicks. Good is under 200 milliseconds. It replaced First Input Delay in 2024 and is considerably harder to pass, because it measures every interaction rather than only the first one.
Cumulative Layout Shift is how much the page jumps around while loading. Good is under 0.1. This is the one that makes you tap the wrong button because an ad loaded above where you were looking.
Your Lighthouse score is not the scoreboard
This is the single most expensive misunderstanding in the field, and almost every agency report leans on it.
Lighthouse and PageSpeed Insights produce lab data. One simulated run, on a throttled mid-tier phone, measured from wherever you happen to be sitting. It is a diagnostic instrument. It is superb at telling you what is wrong.
What Google actually uses for ranking is field data, gathered from real Chrome users and published in the Chrome UX Report. Real devices, real networks, real locations, aggregated over a 28-day rolling window and reported at the 75th percentile.
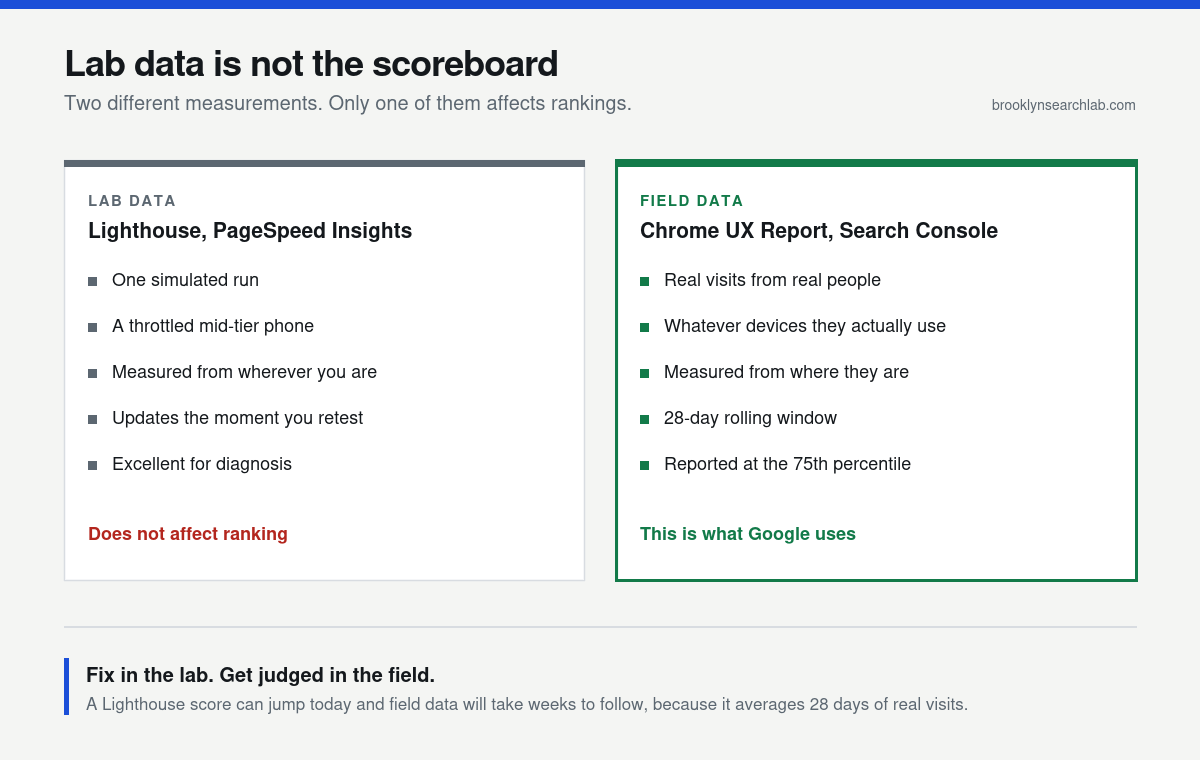
That 75th percentile matters more than people realise. You do not pass by being fast on average. You pass when three quarters of real visits are fast, which means your slowest quarter of visitors decides your fate. Optimising for the average is how sites with respectable lab scores still fail in the field.
This is why our client’s rankings did not move in week one. The lab score jumped the day we deployed. The field data averages 28 days of real visits, so it had barely started to shift. Anyone promising ranking movement the week after a speed fix either does not understand this or is counting on you not to.
How much do Core Web Vitals actually affect rankings?
Less than most people selling them suggest. Google’s own page experience documentation is unusually direct about this: there is no single page experience signal, and great page experience does not override having genuinely relevant content.
The honest model is a tiebreaker. Where two pages are comparably relevant and authoritative, the faster one has an edge. Where one page is far more relevant, speed does not close that gap. You cannot outrun a content and authority deficit with a green score.
Which does not make the work pointless. It makes the reason for doing it different from the reason usually given.
What actually pays: conversion, not position
Here is the part that gets left out of most pitches, and it is the strongest argument for doing the work at all.
A visitor who waits six seconds is frequently not a visitor at all. They are back on the results page tapping your competitor. That loss never appears in your rankings, because the ranking already worked. It appears in your conversion rate, and it is invisible unless you go looking.
So the return on speed work is mostly captured before search rankings enter the picture. More of the traffic you already have becomes enquiries. That is a better argument than a modest tiebreaker, and it happens to be true, which is why we lead with it on our web design engagements rather than promising ranking jumps.
What is noise
Chasing 100
The difference between 95 and 100 is usually days of work for no measurable outcome. The thresholds are pass or fail bands, not a leaderboard. A 95 and a 100 are treated identically by Google. Stop at good.
Desktop scores
Most local businesses see the majority of their traffic on phones. Mobile scores typically run 20 to 30 points below desktop for the same site. Reporting the desktop number is the most common way agencies make a slow site look acceptable. If the report does not say which it is, assume desktop.
Metrics that are not Core Web Vitals
Total Blocking Time, Speed Index and First Contentful Paint all feed the Lighthouse composite. None of them is a ranking signal. Improving them can be worthwhile because they correlate with the ones that matter, but they are diagnostics, not targets.
Plugins that promise to fix it
Caching and optimisation plugins genuinely help with server response and delivery. They cannot fix a theme that ships 1.2MB of unused CSS, a page builder generating nested wrappers, or a hero video nobody needed. Those are build problems, and they need engineering rather than a settings page.
What actually moved our client from 73 to 95
Three changes, all targeting bytes the browser had to fetch and process before it could render anything.
Images converted to WebP. Typically 25 to 35 percent lighter than equivalent JPEG or PNG. Images are usually the largest thing standing between a mobile visitor and a painted page, which makes this the most direct lever on LCP.
Unused CSS removed. Themes and page builders ship stylesheets covering every feature they support, used or not. CSS blocks rendering completely until it is parsed, so dead rules cost real time.
Unused JavaScript removed. Worse than CSS, because the browser downloads it, parses it, and executes it on the main thread. That thread is far slower on a phone, which is exactly why the same change shows a larger gain on mobile than desktop.
No plugin, no configuration toggle. Build-level work, which is the point. The full breakdown is on our case studies page.
Why this matters more in New York
Local search skews heavily mobile, and mobile in New York means a phone on a moving train, in a lift, or on congested midtown cellular. The gap between your Wi-Fi test and your customer’s actual connection is wider here than almost anywhere.
It also compounds with something we have written about before: proximity limits how far your map pack reach extends. Outside that radius you are competing in organic results, where you have no distance advantage and every remaining factor has to carry the weight. Site quality is one of the few levers still fully in your control, which is why it features in both our Brooklyn web design and Manhattan SEO work.
One check worth running before you fund any speed work: confirm the rankings you are trying to protect are real. Averaged Search Console positions routinely flatter a page that nobody actually sees in the results.
Key takeaways
- Lab data diagnoses. Field data ranks. Lighthouse tells you what is wrong. The Chrome UX Report is what Google actually reads.
- Expect a 28-day lag. Field data averages four weeks of real visits, so ranking effects arrive slowly or not at all.
- Core Web Vitals are a tiebreaker, not a substitute for relevance and authority.
- The real return is conversion. Speed keeps the traffic you already earned.
- Stop at good. 95 and 100 are treated identically. Chasing the last five points is theatre.
- Always ask which device. Mobile is the number that counts, and it is the one that gets omitted.
What to do this week
- Open Search Console and find the Core Web Vitals report. That is field data from your actual visitors. It is the only score that carries ranking weight.
- Run PageSpeed Insights on your three highest-value pages, on mobile. Homepage, main service page, contact page. Note LCP specifically.
- Check your largest image. If your hero is a JPEG or PNG over 200KB, converting to WebP is likely your single biggest available gain.
- Compare mobile against desktop. If the gap exceeds 25 points, your problem is main-thread JavaScript rather than server speed.
- Re-measure in four weeks, not four days. Anything sooner is measuring noise.
Common questions
Will fixing Core Web Vitals increase my rankings?
Possibly, modestly, and slowly. It is a tiebreaker between comparable pages, not a lever that lifts weak content. The dependable return is conversion, not position.
Why does my Lighthouse score change every time I run it?
Because it is a single simulated run affected by your connection, your machine, and network conditions at that moment. Variance of five to ten points between runs is normal. Median several runs, or use field data.
My Search Console report says my site fails, but PageSpeed says 95. Which is right?
Both. PageSpeed is showing you a lab result from your connection right now. Search Console is showing 28 days of real visits at the 75th percentile. Trust Search Console for ranking questions and PageSpeed for diagnosis.
Do I need a rebuild, or will optimisation do?
It depends where the weight is. If it is images and third-party scripts, optimisation is usually enough. If your theme or page builder generates the bloat, you are optimising around the problem rather than fixing it. An audit answers this in a few hours, and we say plainly which situation you are in.
Does INP affect my site more than LCP?
For most local business sites, no. LCP is where the failures concentrate, because it is dominated by image and CSS delivery. INP tends to bite on heavily interactive applications. Fix LCP first unless your data says otherwise.
Find out what your site actually scores
The free technical audit includes mobile Lighthouse results, your real field data from Search Console, and a prioritized fix list ordered by impact rather than by what is easy. Five business days, no obligation, yours to keep.
Related: SEO services, web design, case studies.